
Table of Contents
Marketing analytics is how a small business finds out which marketing actually brings in customers and which simply spends money. You may already have more data than you think: website visits, social media reach, email opens, ad clicks and sales records. The problem is that most of it sits in separate tools, and very little of it is turned into decisions.
This guide explains marketing analytics for small business in plain language. You will learn the seven metrics that matter most, how to set up tracking without a data team, and how to run a simple monthly review that turns numbers into growth.
What Is Marketing Analytics?
Marketing analytics is the practice of collecting, connecting and interpreting data from your marketing activities so you can make better decisions. It answers practical questions such as: Where do our best customers come from? How much does it cost to win one? Which campaigns should we stop, and which deserve more budget?
It is different from simply reporting numbers. A report tells you that your website had 3,000 visitors last month. Marketing analytics tells you which 300 of those visitors became leads, which channel brought them and whether that channel is worth the money you spend on it.
Why Marketing Analytics Matters for Small Businesses
Large companies have analysts and dashboards. Small businesses usually have a founder, a busy marketing person and a spreadsheet. That is exactly why good marketing analytics matters more for smaller teams: every rupee, dollar or hour has to work harder.
Limited Budgets Leave No Room for Guesswork
When your marketing budget is small, one poor campaign can use up a whole quarter’s spending. Tracking results lets you spot weak campaigns early and move money to the channels that are already working.
Faster, More Confident Decisions
Without data, marketing decisions are often based on opinion or on whoever speaks loudest in the meeting. With clear metrics, you can agree on what success looks like before a campaign starts and judge it fairly afterwards.
AI Tools Need Clean Data
AI can now forecast demand, segment customers and suggest budget changes. But AI is only as good as the data behind it. Businesses that build reliable marketing analytics today will be the ones that get real value from AI tomorrow. We explore this shift further in our article on AI in marketing by 2027.
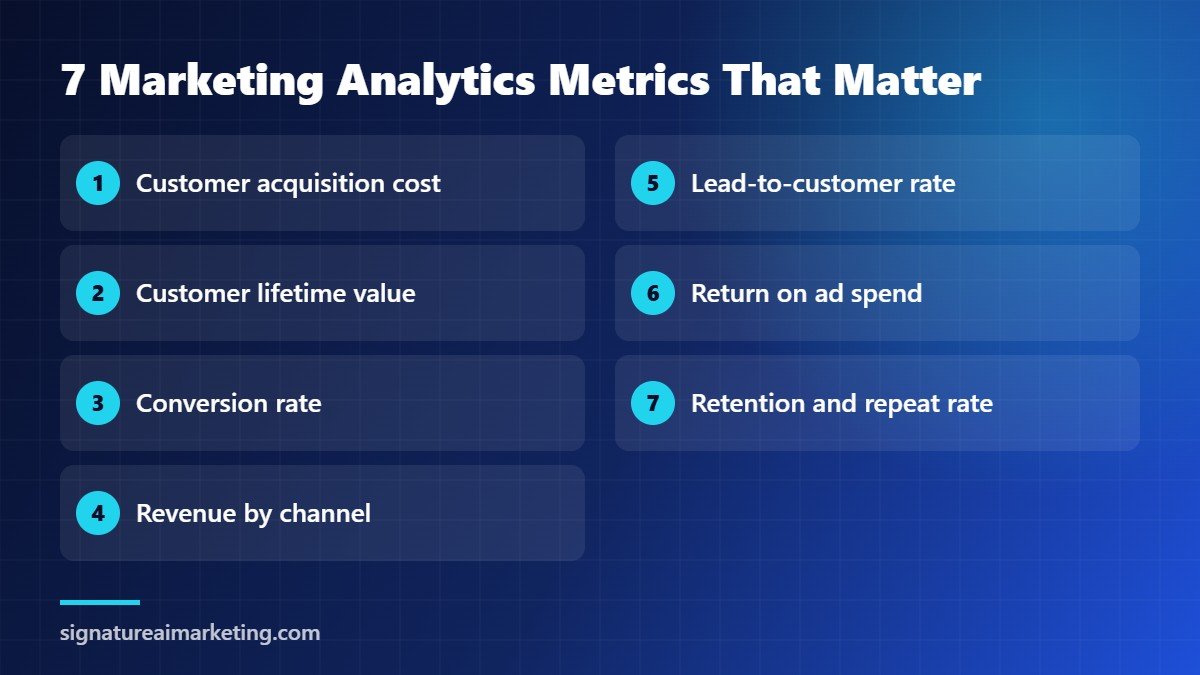
7 Essential Marketing Analytics Metrics for Small Business
You do not need to track hundreds of numbers. These seven metrics give a clear picture of marketing performance for almost any small business, whether you sell services, products or subscriptions.
1. Customer Acquisition Cost (CAC)
Customer acquisition cost is the average amount you spend to win one new customer. Add up your marketing and sales costs for a period, then divide by the number of new customers in the same period.
Example: if you spend 200,000 on ads, tools and freelancers in a month and win 40 new customers, your CAC is 5,000. On its own, this number means little. It becomes powerful when you compare it with how much a customer is worth.
2. Customer Lifetime Value (CLV)
Customer lifetime value estimates the total revenue or profit a typical customer brings over the whole relationship. A simple version is average order value multiplied by the number of purchases a customer makes over their lifetime with you.
A healthy business usually earns several times more from a customer than it spends to acquire one. If your CLV is close to your CAC, you are effectively buying revenue at break-even, and growth will be expensive.
3. Conversion Rate
Conversion rate is the percentage of people who take a desired action, such as filling in a contact form, booking a call or making a purchase. Track it for your whole website and for key landing pages. A small improvement in conversion rate can deliver more growth than a large increase in traffic.
4. Revenue by Channel
Revenue by channel shows how much income comes from each source: organic search, paid ads, social media, email, referrals and direct visits. This is where many small businesses discover surprises, such as a quiet email list that produces more sales than an expensive social media campaign.
5. Lead-to-Customer Rate
For service businesses, not every lead becomes a customer. The lead-to-customer rate shows what share of enquiries turn into paying clients. A falling rate often points to poor lead quality, slow follow-up or a sales process that needs attention, not a marketing problem.
6. Return on Ad Spend (ROAS)
Return on ad spend compares the revenue generated by advertising with the cost of that advertising. If you spend 50,000 on a campaign and it produces 200,000 in sales, your ROAS is 4. Use it to compare campaigns, but remember that ROAS ignores other costs, so always check it against your profit margins.
7. Retention and Repeat Purchase Rate
Winning a new customer usually costs more than keeping an existing one. Retention rate shows how many customers stay with you over time, while repeat purchase rate shows how many buy again. Rising retention is one of the clearest signs that your marketing and your product are working together.
How to Set Up Marketing Analytics Without a Data Team
You can build a reliable marketing analytics foundation in a few weeks with free or low-cost tools. Follow these steps in order:
- Define your goals. Decide which actions matter most, such as purchases, form submissions, calls or bookings. These become your conversions.
- Install analytics properly. Set up Google Analytics 4 on every page and mark your key actions as conversions or key events.
- Tag your campaigns. Add UTM parameters to links in emails, social posts and ads so every visit is credited to the right source.
- Connect your sales data. Link your CRM or sales spreadsheet so you can see which leads became customers and how much they spent.
- Build one simple dashboard. Show the seven metrics above on a single page. If a number does not lead to a decision, leave it out.
- Agree on definitions. Write down what counts as a lead, a customer and a conversion so everyone reads the numbers the same way.
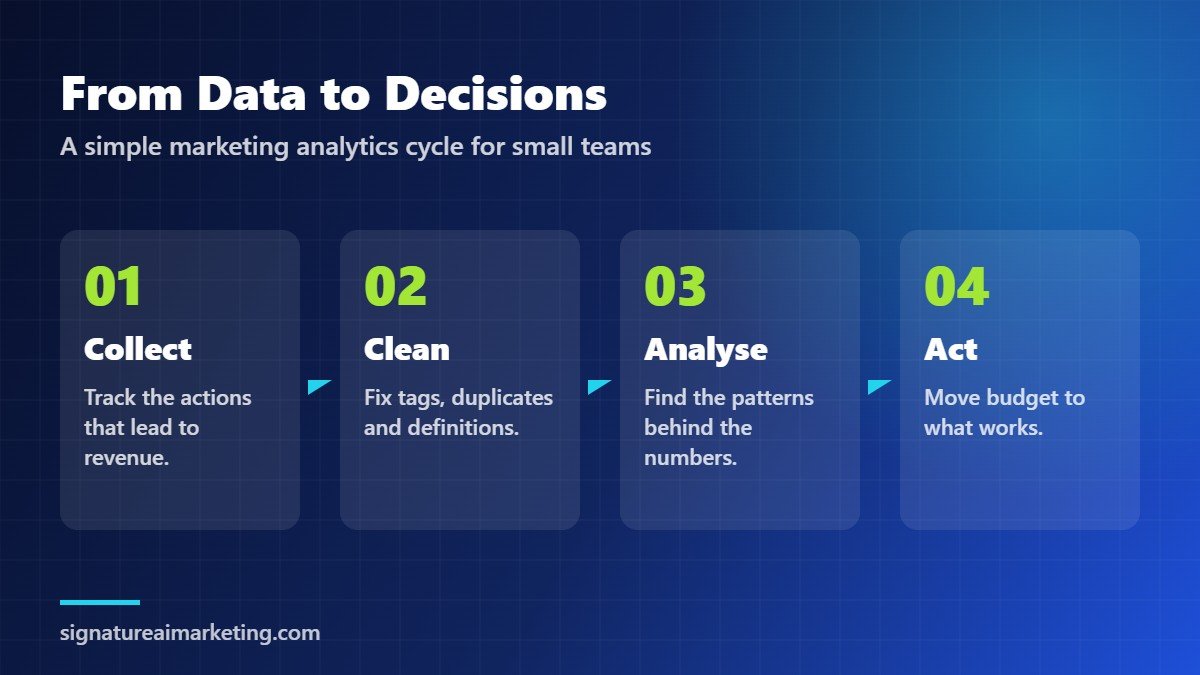
From Data to Decisions: A Simple Monthly Marketing Review
Data only creates value when it changes what you do. A 60-minute monthly review is enough for most small businesses. Use the same agenda every month:
- What happened? Review the seven metrics against last month and the same month last year.
- Why did it happen? Look for the cause behind any big change, such as a new campaign, a website update or a seasonal pattern.
- What will we change? Choose one to three actions, such as moving budget, testing a new offer or fixing a weak landing page.
- How will we know it worked? Set a clear target for each action and check it at the next review.
Over time, these reviews build a record of what works for your business. That record is more valuable than any single report, because it captures lessons that would otherwise be forgotten.
Common Marketing Analytics Mistakes to Avoid
- Chasing vanity metrics. Likes, followers and page views feel good but rarely pay the bills. Focus on numbers linked to revenue.
- Broken or missing tracking. A single missing tag can make a successful campaign look like a failure. Test your tracking after every website change.
- Looking at channels in isolation. Customers often see several touchpoints before buying. A social post may start the journey that a search ad finishes.
- Collecting data without consent. Respect privacy laws and be transparent about cookies and tracking. Trust is part of your brand.
- Reporting without acting. If the monthly report never changes a decision, it is not analytics. It is decoration.
What to Include in a Small Business Marketing Analytics Dashboard
A good dashboard fits on one screen and can be understood in two minutes. If your team has to scroll through dozens of charts, the important signals will be missed. Organise your marketing analytics dashboard around the questions your business needs to answer:
| Dashboard section | What to show | Question it answers |
|---|---|---|
| Growth summary | Revenue, new customers, CAC and CLV | Are we growing profitably? |
| Channel performance | Visits, leads and revenue by channel | Where should the next budget go? |
| Website conversion | Conversion rate for key pages and forms | Is the website turning interest into enquiries? |
| Sales pipeline | Lead-to-customer rate and time to close | Are good leads being followed up quickly? |
| Customer loyalty | Retention and repeat purchase rate | Are customers coming back? |
Keep the dashboard simple at first. You can always add detail later, but it is hard to remove clutter once people are used to seeing it.
Benchmarks: Compare With Yourself Before Comparing With Others
Small business owners often ask whether their numbers are “good”. Industry averages can help, but they vary widely by sector, country, price point and sales cycle. A conversion rate that is excellent for a high-value consultancy may be weak for an online shop.
The most useful benchmark is your own past performance. Compare each metric with the previous month, the previous quarter and the same period last year. Steady improvement against your own baseline is a far more reliable sign of progress than matching someone else’s average.
A 30-Day Marketing Analytics Starter Plan
If you are starting from zero, this four-week plan gives you a working marketing analytics system without overwhelming your team:
- Week 1 – Foundations. List your marketing channels, define your conversions and check that analytics is installed on every page of your website.
- Week 2 – Tracking. Add UTM tags to all campaign links, set up conversion tracking for forms and purchases, and test each one yourself.
- Week 3 – Connection. Link your CRM or sales records so leads can be matched to customers and revenue. Calculate your first CAC and CLV figures.
- Week 4 – Review. Build your one-page dashboard, hold your first monthly review and choose one improvement to test in the following month.
After 30 days you will not have perfect data, and that is fine. You will have something much more valuable: a reliable starting point and a habit of making marketing decisions based on evidence.
Respect Privacy While You Measure
Customers are more aware than ever of how their information is collected and used. Measuring performance does not require collecting everything. Gather only the data you need to answer your business questions, and store it securely.
Use a clear cookie banner where the law requires one, explain in plain language what you track and why, and give people an easy way to opt out. Where possible, rely on first-party data that customers share with you directly, such as email sign-ups, purchase history and survey answers. This kind of information is usually more accurate than third-party data, and it builds trust instead of eroding it.
Finally, review who in your team can access customer records. Limiting access to the people who genuinely need it reduces risk and makes it easier to comply with data protection rules as your business grows.
How AI Is Changing Marketing Analytics
AI is making marketing analytics faster and more accessible. Modern tools can spot unusual changes in traffic, predict which leads are most likely to buy and group customers by behaviour without manual work. For small businesses, this means insights that once needed an analyst can now be produced in minutes.
However, AI does not remove the need for judgement. Someone still has to ask the right questions, check whether a prediction makes sense and decide what to do next. AI also works best when it is connected to clean data and clear automation rules, which is where a marketing automation specialist can add real value.
How Signature AI Marketing Can Help
At Signature AI Marketing, our Data & Analytics service turns scattered marketing data into a clear picture of what drives growth. We fix tracking, connect your channels, build dashboards around the numbers that move your business and add AI-powered forecasting when you are ready for it.
If you are not sure which of your marketing activities are paying off, contact us for a conversation about your goals. We will give you an honest view of where your marketing analytics stands today and the quickest wins available.
Frequently Asked Questions About Marketing Analytics
What is marketing analytics in simple terms?
Marketing analytics is the process of measuring and analysing marketing results so you can see what works, what does not and where to spend your budget next.
Which marketing analytics metrics should a small business track first?
Start with customer acquisition cost, customer lifetime value, conversion rate and revenue by channel. Once these are reliable, add lead-to-customer rate, return on ad spend and retention.
Do I need expensive software for marketing analytics?
No. Most small businesses can start with Google Analytics 4, a CRM or well-organised spreadsheet, and a simple dashboard tool. The quality of your tracking matters far more than the price of your software.
How often should I review my marketing data?
Check key campaigns weekly and run a full review of your marketing analytics once a month. Quarterly reviews are useful for bigger decisions such as changing budgets or entering a new channel.
How does AI help with marketing analytics?
AI can detect unusual patterns, forecast results, score leads and segment customers automatically. It saves time, but it still needs clean data and human oversight to produce reliable decisions.
What is the difference between marketing analytics and web analytics?
Web analytics measures what happens on your website, such as visits, page views and form submissions. Marketing analytics is broader. It connects website data with advertising, email, social media and sales records to show how all your marketing activities work together to create customers and revenue.
About the Author
Dr. Atique Ur Rehman is the founder and CEO of Digital and AI Solutions (DAIS) and a retired military officer with UN peacekeeping experience. He is the author of more than 20 books on geopolitics, governance, and AI, including The Sovereign Inforg, Future of Humanity, and New Information Order.
He holds a PhD in International Relations and writes for The Nation and Daily Times.
One Response